Black Bear Quick Facts and Stats
General Facts and Stats
Application Statistics
First Year Applications:15,046
Transfers: 1,791
Early Action: Dec 1
New First Year Student Averages
GPA: 3.35
SAT Evidence Based: 584
Quantitative Reasoning: 579
ACT Composite: 22
Retention to 2nd year: 74%
19 Residence Facilities
First Year student living on campus: 89%
Undergraduates living on campus: 38%
12 Themed and Living Learning Communities
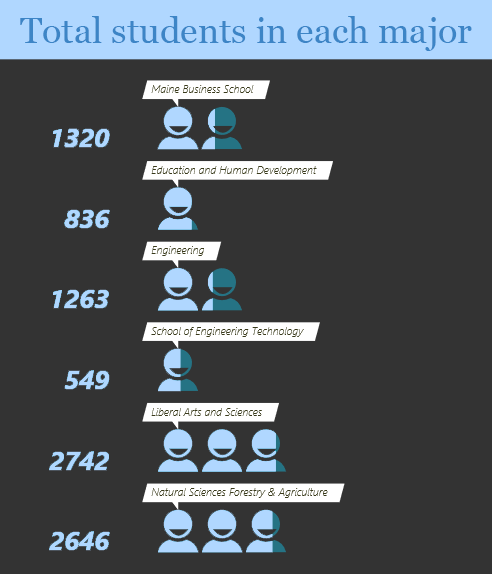
Student Facts and Stats
Faculty Facts and Stats
866 total faculty
53% male/47% Female
10% Minority groups
16:1 Student to Faculty Ratio
70% Classes with 40 students or less


